
Satellite imagery has become one of the most widely used tools in modern agronomy. Vegetation indices such as NDVI allow us to monitor crop growth across entire fields and quickly identify areas where crops appear stronger or weaker.
In many cases the interpretation seems straightforward: areas with higher NDVI values have more biomass and therefore should produce higher yields.
Yet growers and agronomists often encounter situations where this expectation does not hold. Fields that show strong NDVI during the season sometimes produce only average yields, while other areas with moderate NDVI perform surprisingly well at harvest.
Understanding why this happens is important, because NDVI is a powerful tool, but only when its signals are interpreted correctly.
NDVI measures biomass, not yield potential
NDVI is fundamentally a measure of green vegetation density. It reflects how much light the crop canopy absorbs and how much is reflected in the near-infrared spectrum.
As a result, NDVI is very effective at capturing differences in:
- leaf area
- canopy density
- early crop vigor
- biomass accumulation
However, NDVI does not directly measure yield potential. Yield depends not only on vegetative growth, but also on how efficiently the crop converts biomass into harvestable product.
In cereals this means grain formation and filling. In many other crops it means fruit or tuber development.
A crop can produce a large amount of vegetative biomass and still fail to convert that growth into yield.
When strong NDVI reflects excessive vegetative growth
One common situation occurs when crops receive abundant nitrogen early in the season. Nitrogen stimulates vegetative growth, increasing leaf area and canopy density. As a result, NDVI values rise quickly and fields appear very healthy.
However, excessive vegetative growth can create new limitations later in the season. Dense canopies increase transpiration demand and can accelerate water depletion in the soil. If water becomes limiting during critical reproductive stages, yield potential may decline despite the strong early growth.
In this case, NDVI correctly reflects vigorous vegetative development, but it does not indicate whether the crop will successfully complete the reproductive phase.
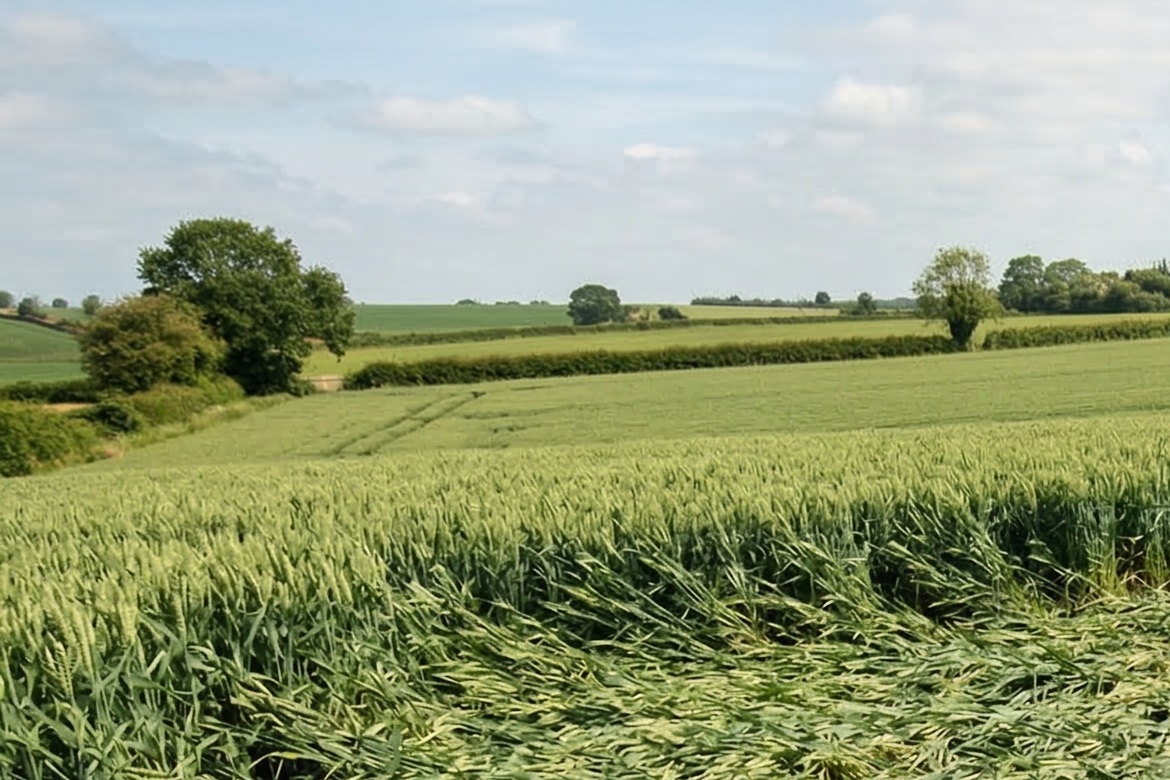
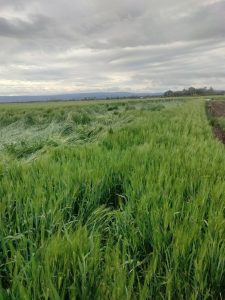
When high NDVI hides lodging problems
Another situation where NDVI can be misleading occurs when crops lodge.
In cereals, lodging often results from rapid vegetative growth combined with wind, rain, or weak stem strength. Even after lodging occurs, the canopy may still appear dense and green from above.
Because NDVI primarily measures canopy density and chlorophyll activity, lodged crops can still show relatively high NDVI values. From satellite imagery alone, the crop may appear healthy.
However, lodging significantly reduces yield potential. Plants intercept light less efficiently, grain filling becomes uneven, and harvest losses increase.
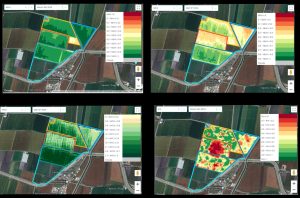
In these situations, other vegetation indices that are more sensitive to canopy structure can provide additional information. For example, RVI (Ratio Vegetation Index) can sometimes help reveal irregular canopy patterns associated with lodging.
The figure below shows an example from where NDVI alone suggested strong crop growth, while additional vegetation indices helped identify structural canopy issues related to lodging and declining chlorophyll levels approaching harvest.
Water availability often explains the difference
Water availability is another important driver behind situations where NDVI and yield diverge.
Early in the season, when soil moisture is still sufficient, crops across a field may develop similar canopy density. NDVI values therefore appear uniformly high.
As the season progresses, however, differences in soil water holding capacity, root depth, or irrigation distribution begin to influence crop performance.
Areas with deeper soils or higher water retention may sustain grain filling or fruit development longer. Other areas may experience water stress during critical growth stages.
By the time yield is determined, these differences become visible in the harvest results, even though NDVI during earlier growth stages appeared similar.
Timing matters when interpreting satellite imagery
Another important factor is the timing of NDVI measurements.
Vegetation indices capture the state of the crop canopy at the moment the satellite image is taken. If you analyze the imagery only during early vegetative stages, it may reflect canopy development rather than final yield potential.
In many crops, yield is strongly influenced by conditions occurring later in the season, such as:
- water availability during reproductive stages
- heat stress during flowering
- disease pressure
- nutrient availability during grain filling or fruit development
If these factors occur after peak canopy development, NDVI measurements taken earlier may not reflect the final crop outcome.
For this reason, interpreting NDVI often requires looking at the full seasonal pattern, rather than a single image.
Crop vigor is not always crop productivity
Agronomists often use terms like crop vigor and crop performance interchangeably, but they are not always the same.
Crop vigor generally refers to the speed and strength of vegetative growth. A vigorous crop produces leaves quickly and forms a dense canopy.
Crop productivity, on the other hand, refers to the crop’s ability to produce harvestable yield.
While the two are often correlated, they are not identical. Under some conditions, strong vegetative growth can actually reduce yield potential by increasing competition for water or by shifting plant resources away from reproductive development.
Recognizing this difference helps explain why fields with high NDVI sometimes produce disappointing yields.
Interpreting NDVI in the context of the field system
NDVI becomes much more valuable when interpreted alongside other information about the field.
For example, satellite imagery can be compared with:
- soil maps
- elevation and terrain models
- irrigation patterns
- historical yield patterns
- fertilizer application records
When we examine these layers together, relationships between crop growth and field conditions often become clearer.
By combining multiple data sources, agronomists can move beyond simply observing crop vigor and begin identifying the drivers behind crop performance.
NDVI is a proxy, not a diagnosis
NDVI is extremely useful for identifying spatial patterns in crop growth. It helps agronomists detect variability, monitor crop development, and quickly locate areas that deserve closer inspection.
However, NDVI should be understood as a proxy for canopy development, not as a direct indicator of yield potential.
A high NDVI value simply indicates a dense and active canopy. It does not explain why that canopy developed, nor does it guarantee that the crop will convert biomass into yield.
For example, high NDVI may reflect strong vegetative growth driven by nitrogen, adequate early-season moisture, or favorable temperatures. None of these factors alone ensure that the crop will maintain performance through reproductive stages or grain filling.
For this reason, you should interpret satellite imagery one layer of information within the broader field system. Soil conditions, water availability, crop stage, and weather during critical growth periods ultimately determine the final yield.
Used in this way, NDVI becomes a powerful tool for identifying where variability occurs and guiding further agronomic investigation.
